Interactive Chart: Lexington homicides 1985 – 2021
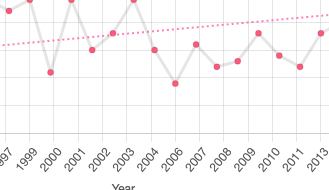
Here’s an interactive chart of Lexington homicides between 1985 and 2021. For unknown reasons, no data is available for 1988.
Correction: a previous version of this post incorrectly listed the year a local politician took office and the post has been updated.
As always, please rotate your phone to properly view and interact with the chart.
Source: FBI Crime Data Explorer
Recommended Posts

Lexington City Council to consider $400,000 aid for homeless families with schoolchildren
Fri, March 1, 2024

Bills aim to stop people from coming to Ky. to have Medicaid pay for addiction treatment; programs could have to get them home
Mon, February 26, 2024

How Will Lexington’s Economy Grow Over the Next Two Years?
Mon, February 26, 2024